Custom Scaling
The scaling of the color mapping is controlled by providing a subclass of the abstract class Scale. Two
building scales are provided. LinearScale provides a linear scaling between 0 and an upper limit, and
LogScale provides a logarithmic scaling.
To demonstrate creation of a custom scaling in this tutorial we’ll implement a normalized scale,
which results in a phase image by normalizing the magnitude (generally LogScale would be sufficient while
maintaining magnitude information); we’ll also implement a split linear scale which is just a pair of linear scales with a
central point mapped to a specified luminance value.
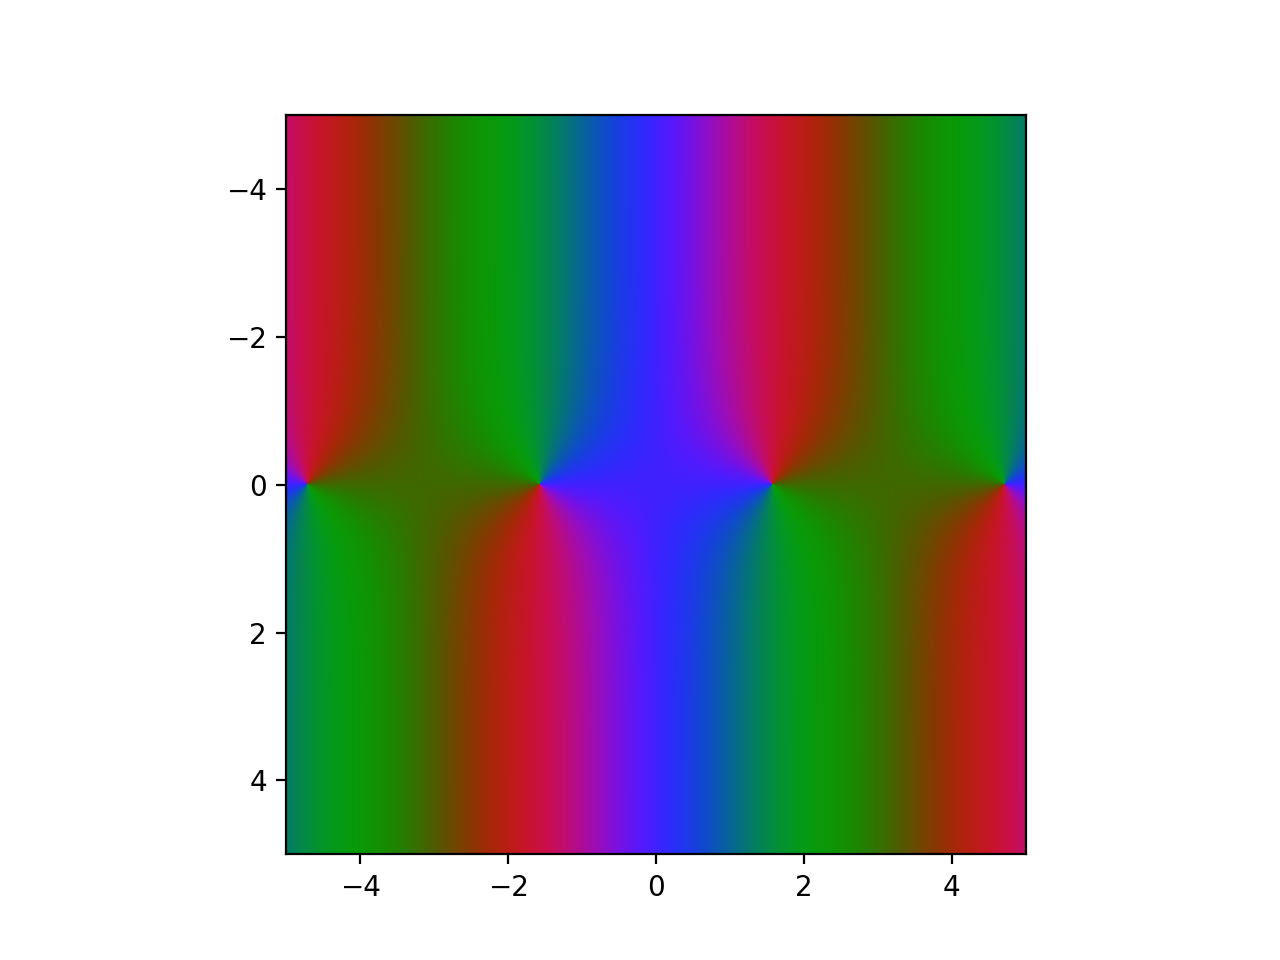
Normalized Scale
This scale is very simple. We simply divide the complex value by its magnitude, however we need to handle 0 specially,
since we can’t recover the phase information for 0 value anyway we just leave them as zero i.e. divide by 1 instead of
the magnitude i.e. we use the expression (magnitude > 0)*(magnitude) + (magnitude == 0) to find the normalization
factor and avoid a division by zero error. Also since such a scale can’t support a colorbar only the __call__
method needs to be implemented.
import ZtoRGBpy

class NormalizedScale(ZtoRGBpy.Scale):
    """Normalize the magnitude to 1"""

    def __call__(self, value):
        """Transform value with scaling function"""
        magnitude = abs(value)
        value /= (magnitude > 0)*(magnitude) + (magnitude == 0)
        return value

import numpy as np
import matplotlib.pyplot as plt

r = np.linspace(-5,5, 2001)
x,y = np.meshgrid(r,r)
z = x + 1j*y

ZtoRGBpy.imshow(np.cos(z),
                scale=NormalizedScale,
                extent=[-5,5,5,-5])
plt.show()
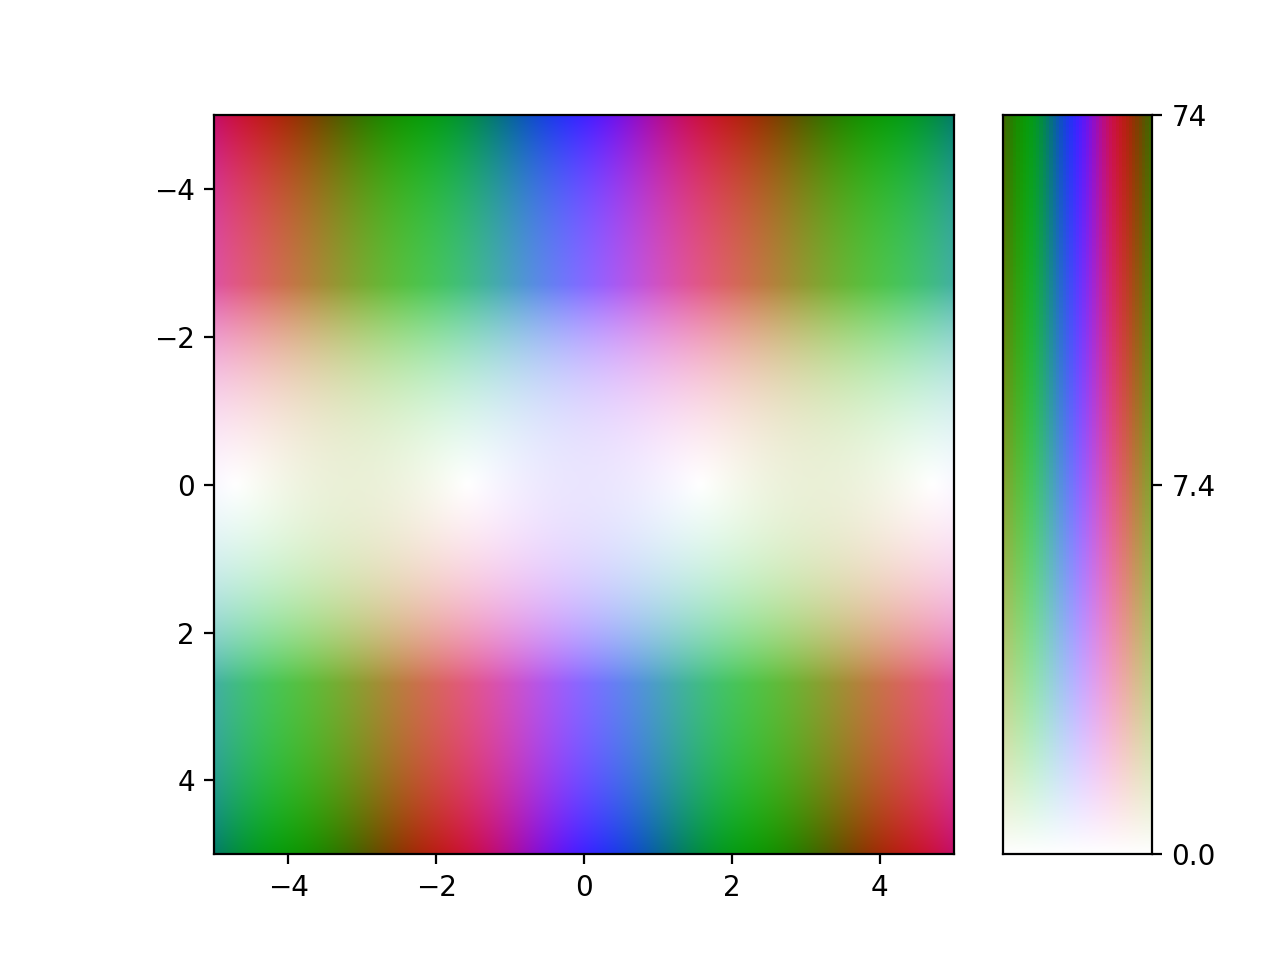
Split Linear Scale
In this case we want to make small values more visible while still using a linear scale such as mapping the point that
is 10% of the value range to 50% of the luminance range. Either side of this point the scale should be linear. This Scale
has 3 parameters, the maximum value, the value midpoint fraction (10%), and the luminance midpoint fraction (50%),
however remap when passed a subclass of Scale which accepts more than one positional argument
assumes the first two are the minimum and maximum magnitudes of the data respectively, hence the later two must be
defined as keyword only arguments.
import ZtoRGBpy
import numpy as np

class SplitLinearScale(ZtoRGBpy.Scale):
    """Normalize the magnitude to 1"""

    def __init__(self, max, *, vmid=0.1, lmid=0.5):
        self.max = max
        self.vmid = vmid
        self.lmid = lmid

    def __call__(self, value):
        """Transform value with scaling function"""
        result = np.zeros_like(value)
        cutoff = self.max*self.vmid
        upper_factor = (1.0 - self.lmid)/(self.max - cutoff)
        lower_factor = self.lmid/cutoff
        if np.any(np.iscomplex(value)):
            angle = np.angle(value)
            zcutoff = cutoff*np.exp(1j*angle)
            zmid = self.lmid*np.exp(1j*angle)
        else:
            zcutoff = cutoff
            zmid = self.lmid
        result += (abs(value) >= cutoff)*(zmid + upper_factor*(value - zcutoff))
        result += (abs(value) < cutoff)*(lower_factor*value)
        return result

    def ticks(self):
        return [0.0, self.lmid, 1.0], ["0.0",
                                       "{0:.2g}".format(self.max*self.vmid),
                                       "{0:.2g}".format(self.max)]

    def __repr__(self):
        return super(SplitLinearScale,self).__repr__("{0:g}, "
                "vmid={1:g}, lmid={2:g}".format(
                    self.max, self.vmid, self.lmid))


import matplotlib.pyplot as plt

r = np.linspace(-5,5, 2001)
x,y = np.meshgrid(r,r)
z = x + 1j*y

ZtoRGBpy.imshow(np.cos(z),
                scale=SplitLinearScale,
                extent=[-5,5,5,-5])
ZtoRGBpy.colorbar()
plt.show()
