Using Colorbars
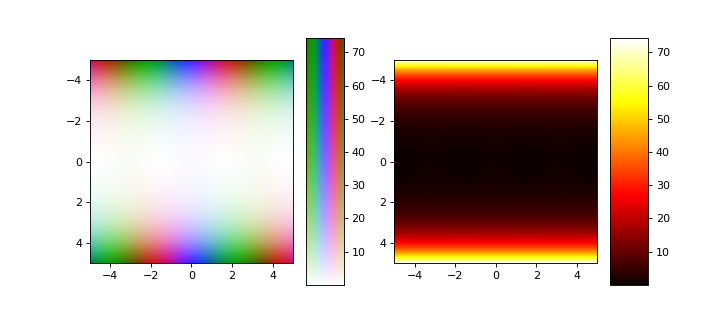
While the ZtoRGBpy.colorbar behaves similarly to pyplot.colorbar, its
behaviour is subtly different. This difference is noticeable when plotting several subplots using different colorbars.
import ZtoRGBpy
import numpy as np
import matplotlib.pyplot as plt

r = np.linspace(-5,5, 2001)
x,y = np.meshgrid(r,r)
z = x + 1j*y

plt.figure(figsize=(9,4))
plt.subplot(121)
ZtoRGBpy.imshow(np.cos(z), extent=[-5, 5, 5, -5])
ZtoRGBpy.colorbar()
plt.subplot(122)
plt.imshow(abs(np.cos(z)), cmap='hot', extent=[-5, 5, 5, -5])
plt.colorbar()
plt.show()

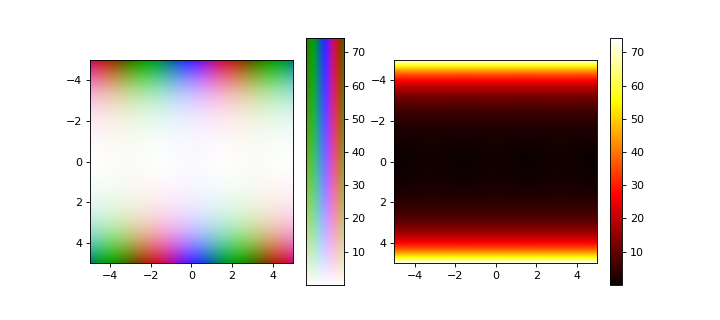
This occurs because ZtoRGBpy draws the colorbar by using imshow with aspect='auto', thus the solution
is to set the aspect ratio of the normal colorbar to auto as well. This can be done as:
import ZtoRGBpy
import numpy as np
import matplotlib.pyplot as plt

r = np.linspace(-5,5, 2001)
x,y = np.meshgrid(r,r)
z = x + 1j*y

plt.figure(figsize=(9,4))
plt.subplot(121)
ZtoRGBpy.imshow(np.cos(z), extent=[-5, 5, 5, -5])
ZtoRGBpy.colorbar()
plt.subplot(122)
plt.imshow(abs(np.cos(z)), cmap='hot', extent=[-5, 5, 5, -5])
plt.colorbar().ax.set_aspect('auto')
plt.show()