Basic Usage
This tutorial cover the general usage of ZtoRGBpy.
Mapping Complex Field to RGB data
The main interface of ZtoRGBpy, is the remap function which takes a
N dimensional Array of complex values and transforms it into a
N+1 dimensional Array of real values where the last dimension represents the RGB color
triplet. Generally, this would be used with 2D images of complex fields, or possibly 3D data cubes representing a
volumetric complex field.
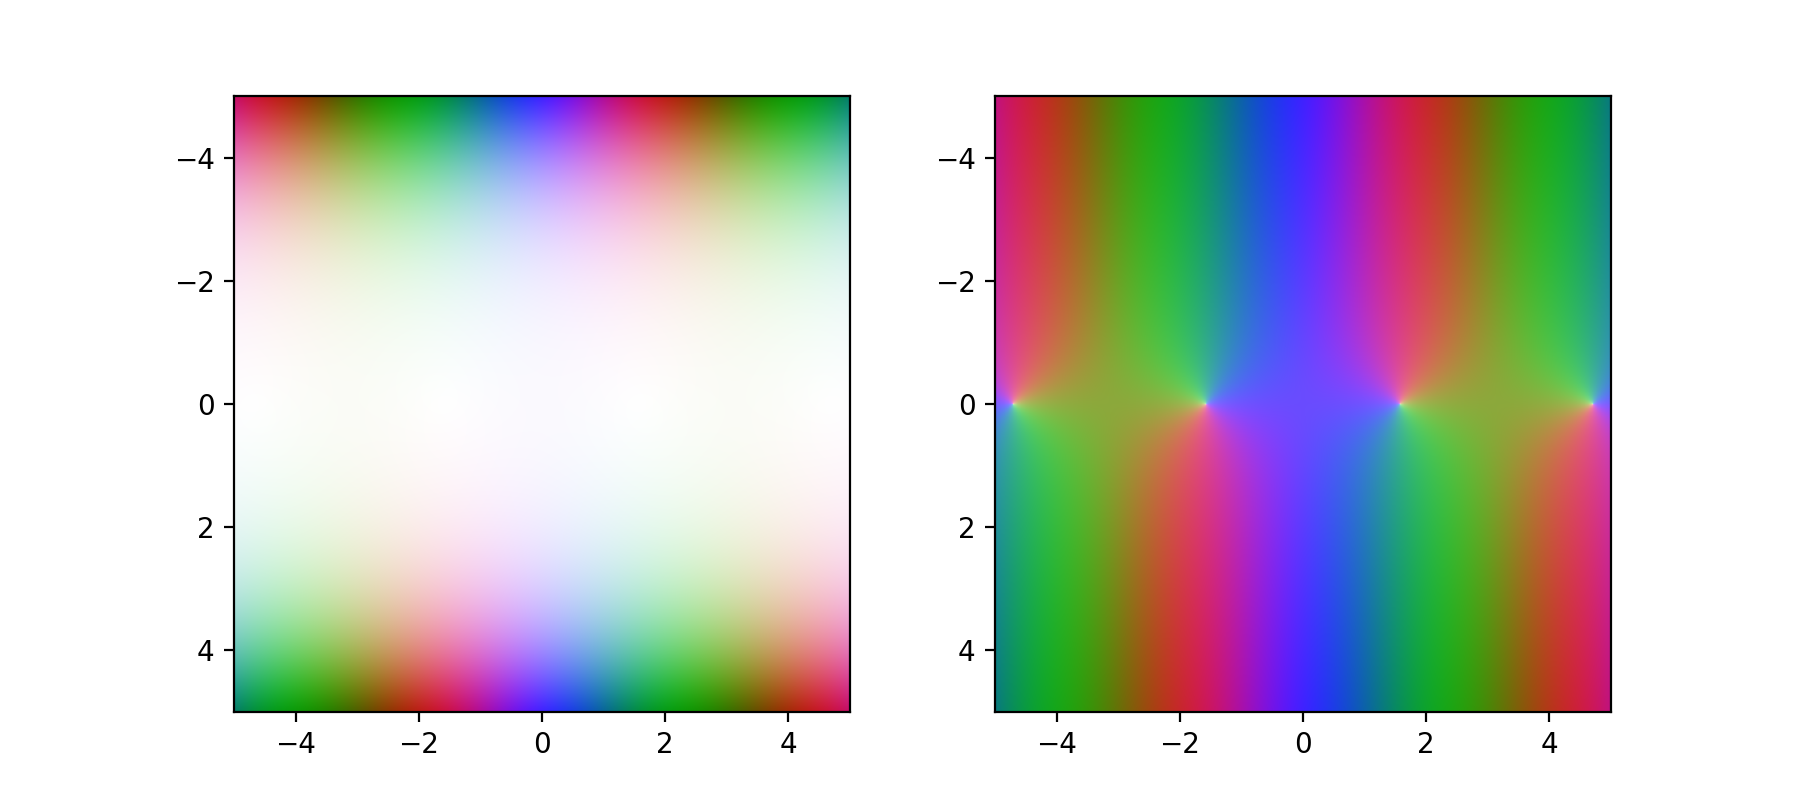
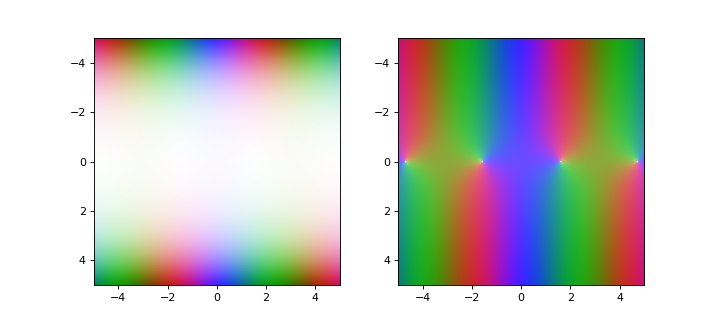
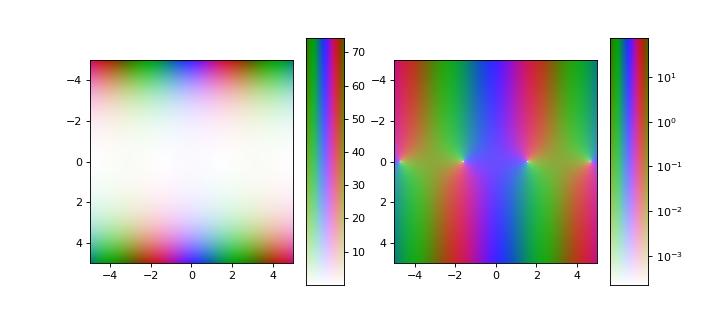
Let’s consider a simple complex function the cosine of the \(x + \iota y\):
import ZtoRGBpy
import numpy as np

r = np.linspace(-5,5, 2001)
x,y = np.meshgrid(r,r)
z = x + 1j*y

rgb = ZtoRGBpy.remap(np.cos(z))
This will produce a linear mapping of \(\cos\left(x + \iota y\right)\) to the sRGB[2] colorspace as described by Fletcher 2019[1]. The logarithmic mapping can be created by:
rgb = ZtoRGBpy.remap(np.cos(z), scale="log")
given that the data doesn’t contain a zero. For 2D data such as in the examples above the output format is suitable for
passing to matplotlib’s, plotting image function imshow().
import ZtoRGBpy
import numpy as np

r = np.linspace(-5,5, 2001)
x,y = np.meshgrid(r,r)
z = x + 1j*y

rgblinear = ZtoRGBpy.remap(np.cos(z))
rgblog = ZtoRGBpy.remap(np.cos(z), scale='log')

import matplotlib.pyplot as plt

plt.figure(figsize=(9,4))
plt.subplot(121)
plt.imshow(rgblinear, extent=[-5,5,5,-5])
plt.subplot(122)
plt.imshow(rgblog, extent=[-5,5,5,-5])
plt.show()
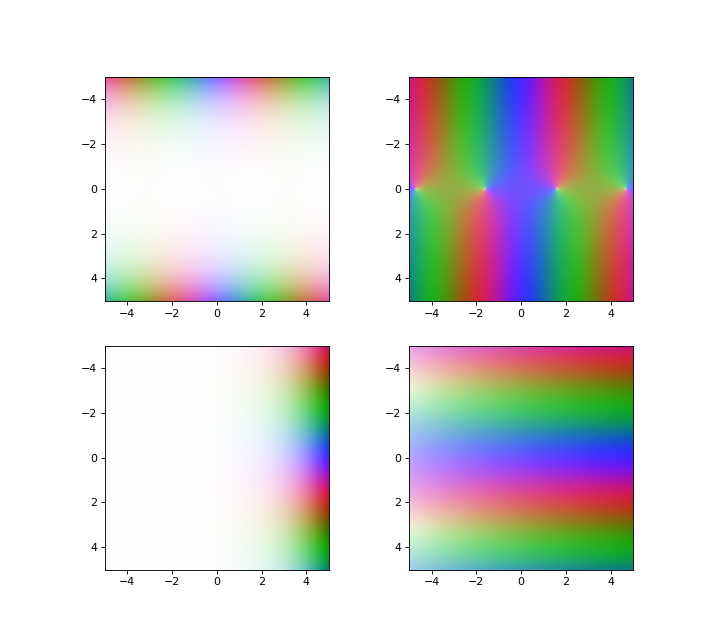
Scaling Data
The automatic scaling is perfectly good for individual fields but when there are several related fields it’s important
that they are all mapped to the same scale otherwise they can’t be compared directly. This can be achieved by passing
an instance of one of the scaling classes LinearScale or LogScale as the scale parameter.
LinearScale takes a single argument (the maximum magnitude of the scale), while LogScale takes
three arguments (the minimum magnitude, the maximum magnitude and the lightness limit which you can generally leave as the default).
import ZtoRGBpy
import numpy as np

r = np.linspace(-5,5, 2001)
x,y = np.meshgrid(r,r)
z = x + 1j*y

cz = np.cos(z)
ez = np.exp(z)

vmin = min(abs(cz).min(), abs(ez).min())
vmax = max(abs(cz).max(), abs(ez).max())
linear = ZtoRGBpy.LinearScale(vmax)
log = ZtoRGBpy.LogScale(vmin, vmax)

czlinear = ZtoRGBpy.remap(cz, scale=linear)
czlog = ZtoRGBpy.remap(cz, scale=log)
ezlinear = ZtoRGBpy.remap(ez, scale=linear)
ezlog = ZtoRGBpy.remap(ez, scale=log)

import matplotlib.pyplot as plt

plt.figure(figsize=(9,8))
plt.subplot(221)
plt.imshow(czlinear, extent=[-5,5,5,-5])
plt.subplot(222)
plt.imshow(czlog, extent=[-5,5,5,-5])
plt.subplot(223)
plt.imshow(ezlinear, extent=[-5,5,5,-5])
plt.subplot(224)
plt.imshow(ezlog, extent=[-5,5,5,-5])
plt.show()

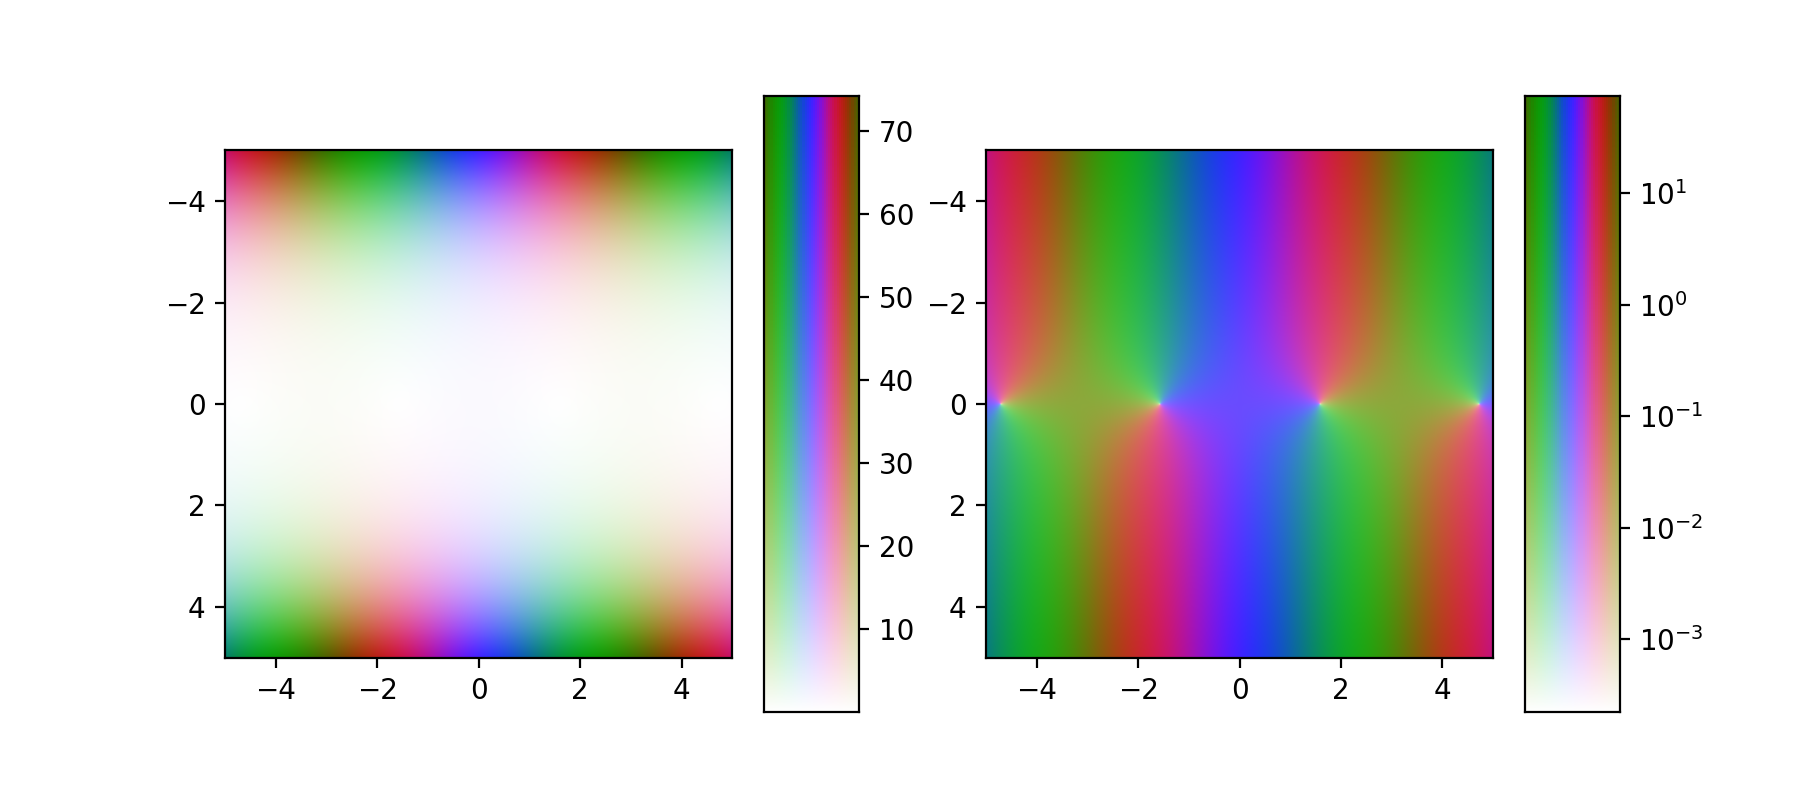
Matplotlib integration
While remap is useful if you need the raw RGB data, if you just want to display an image plot of the complex
field you can use the matplotlib integrations functions imshow and colorbar which have been
designed to behave as similarly to the matplotlib versions as possible but applying to the plotting of complex fields.
import ZtoRGBpy
import numpy as np

r = np.linspace(-5,5, 2001)
x,y = np.meshgrid(r,r)
z = x + 1j*y

import matplotlib.pyplot as plt

plt.figure(figsize=(9,4))
plt.subplot(121)
ZtoRGBpy.imshow(np.cos(z), extent=[-5,5,5,-5])
ZtoRGBpy.colorbar()
plt.subplot(122)
ZtoRGBpy.imshow(np.cos(z), scale='log', extent=[-5,5,5,-5])
ZtoRGBpy.colorbar()
plt.show()
| [1] | Glen Fletcher. A Perceptually Uniform RGB Subset for Representing Complex-valued Data. Technical Report, University of Technology Sydney, 2019. URL: https://glenfletcher.com/research/a-perceptually-uniform-rgb-subset-for-representing-complex-valued-data/. |
| [2] | International Electrotechnical Commission. Colour Measurement and Management in Multimedia Systems and Equipment. 1998. URL: http://www2.units.it/ipl/students_area/imm2/files/Colore1/sRGB.pdf. |