ZtoRGBpy.imshow
-
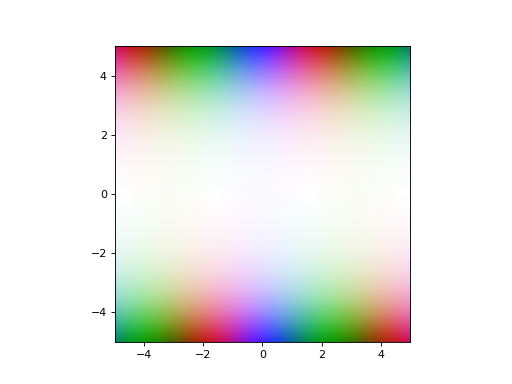
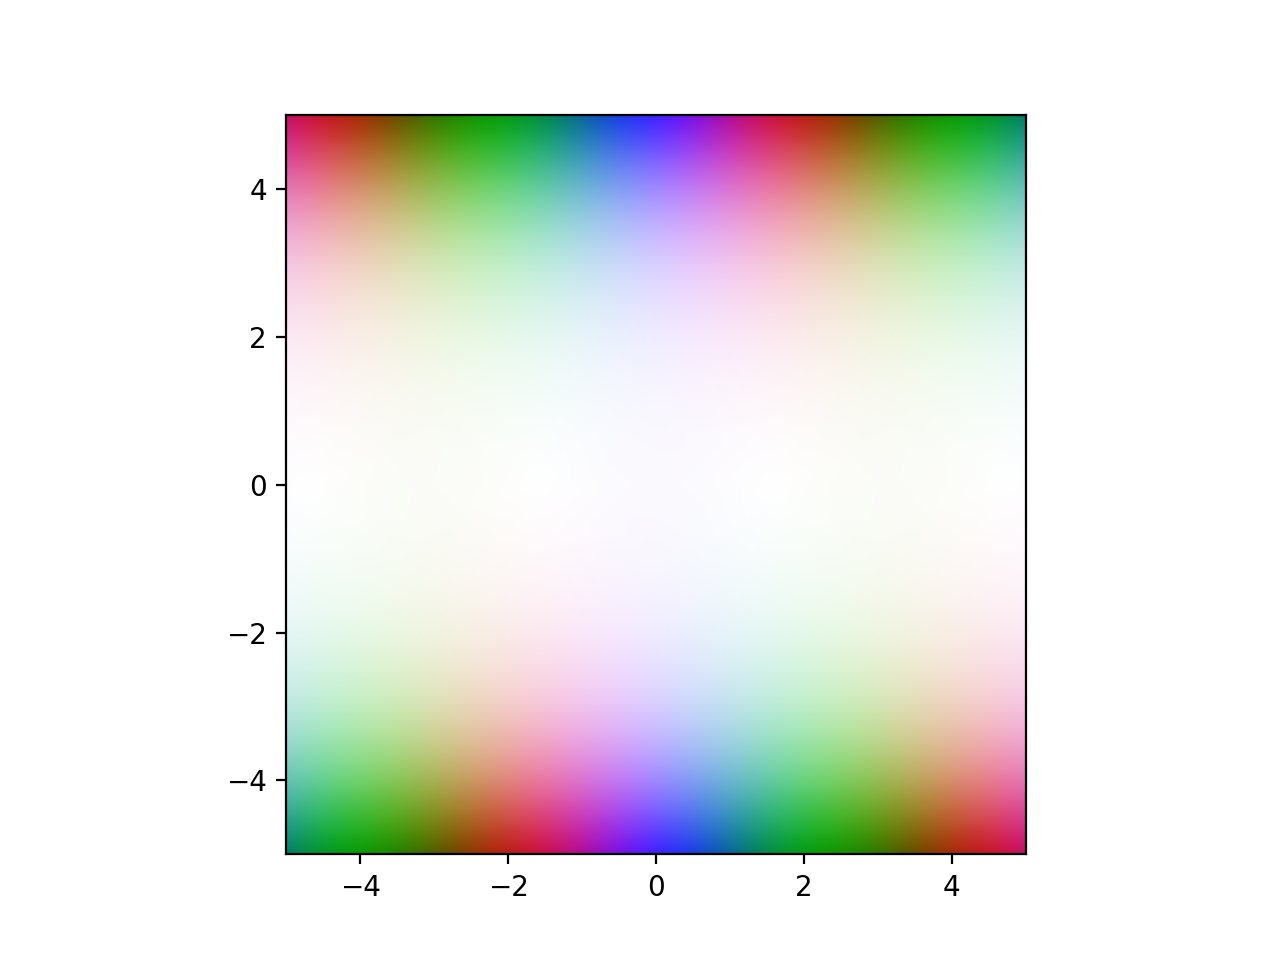
imshow(z, ax=None, scale=None, profile=None, **kwargs)[source]¶ Displays a complex image on the ax or the current axes.
Invokes
matplotlib.axes.Axes.imshowon the results ofremap(z, scale, profile) and attachs scale and profile to the returned object as metadata.Parameters: - z (
array_like[N, M]) – The complex data. This is mapped to colors based onremap(z, scale=scale, profile=profile) - ax (
Axes, optional, default:None) – Theaxesto plot to. IfNoneuse the current axes likepyplot.imshow - scale (
Scale, optional, default:None) – This parameter is passed directly toremap(z, scale=scale, profile=profile) - profile (
RGBColorProfile, optional, default:None) – This parameter is passed directly toremap(z, scale=scale, profile=profile)
Other Parameters: **kwargs (
matplotlib.axes.Axes.imshowparameters) – These parameters are passed to the underlying matplotlib functionReturns: image (
matplotlib.image.AxesImage) – Extra metadata about the complex mapping is added to this object- z (