ZtoRGBpy.colorwheel
-
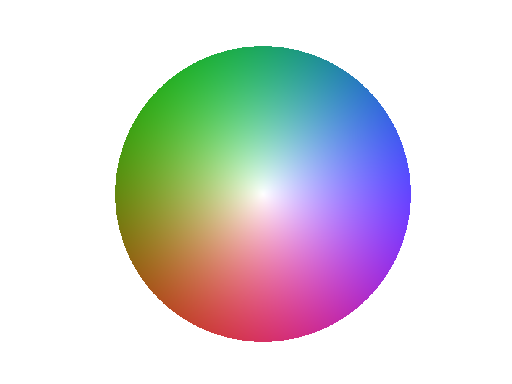
colorwheel(ax=None, scale=None, profile=None, rotation=0, grid=False)[source]¶ Renders a colorwheel, showing the colorspace, with optional grid
Parameters: - ax (
Axes, optional, default:None) – The axes to plot to. IfNone, use the current axes likepyplot.imshow - scale (
Scale, optional, default:None) – This parameter is passed directly toremap(Z, scale=scale, profile=profile) - profile (
RGBColorProfile, optional, default:None) – This parameter is passed directly toremap(Z, scale=scale, profile=profile) - rotation (
float, optional, default:0) – This is the angle in radians by which the colorwheel is rotated - grid (
bool, optional, default:False) – Boolean indicating if the grid should be drawn
Returns: - ax (
