ZtoRGBpy.colorbar
-
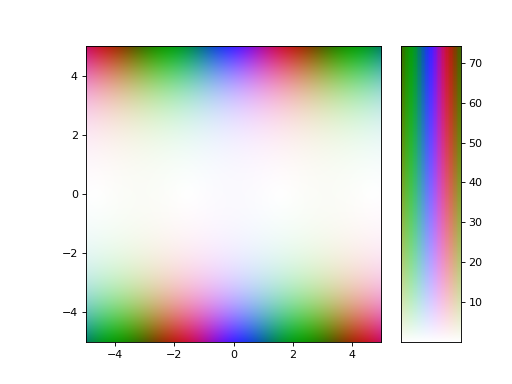
colorbar(mappable=None, ax=None, cax=None, scale=None, profile=None, use_gridspec=True, **kw)[source]¶ Generate a Matplotlib Colorbar
Renders a special colorbar showing phase rotation on the opposite axis to the magnitude (no axis labels)
Parameters: - mappable (
AxesImagewith ZtoRGBpy meta data, optional, default:None) – AnAxesImageas returned byimshoworcolorwheel. Defaults to the current image, ifNone. - ax (
Axes, list of Axes, optional, default:None) – Parent axes from which space for a new colorbar axes will be stolen. If a list of axes is given they will all be resized to make room for the colorbar axes. - cax (
Axes, optional, default:None) – Axes into which the colorbar will be drawn. - scale (
Scale, optional, default:None) –Scaleused by the mapping that the colorbar represents. Defaults to the scale include in the ZtoRGBpy meta data for the mappable being used, - profile (
RGBColorProfile, optional, default:None) –RGBColorProfileused by the mapping that the colorbar represents. Defaults to the profile include in the ZtoRGBpy meta data for the mappable being used, - use_gridspec (
bool, optional, default:True) – IfcaxisNone, a newcaxis created as an instance of Axes. Ifaxis an instance ofSubplotanduse_gridspecisTrue,caxis created as an instance of Subplot using thegrid_specmodule.
Other Parameters: **kwargs (
matplotlib.colorbar.make_axesparameters) – These parameters are passed to the underlying matplotlib function, used to generate the colorbar axesReturns: - mappable (
